

My research examines how Canadian media navigates the AI transition, revealing a significant "policy gap" between major outlets and resource-strapped local newsrooms. While the industry is experimenting with automation for efficiency, my findings show that editors still prioritize human judgment and traditional ethics over AI technical skills in new hires. Domestically, this work highlights the need for national ethical standards; internationally, it serves as a case study on maintaining journalistic integrity and public trust in an era of rapid technological disruption.
Part 1: AI in Canadian newsrooms: media engaging cautiously | Link
Part 2: AI in Canadian newsrooms: what do newsrooms in Canada expect from new hires regarding AI literacy? | Link
This was a small independent research project for Newmark J-School at CUNY, involving gathering data on the current job market, cleaning, analyzing and visualizing data with charts and graphs to find out what product-related skills were needed in the American journalism industry.
The Social Media Lab at Ted Rogers School of Business, Toronto Metropolitan University
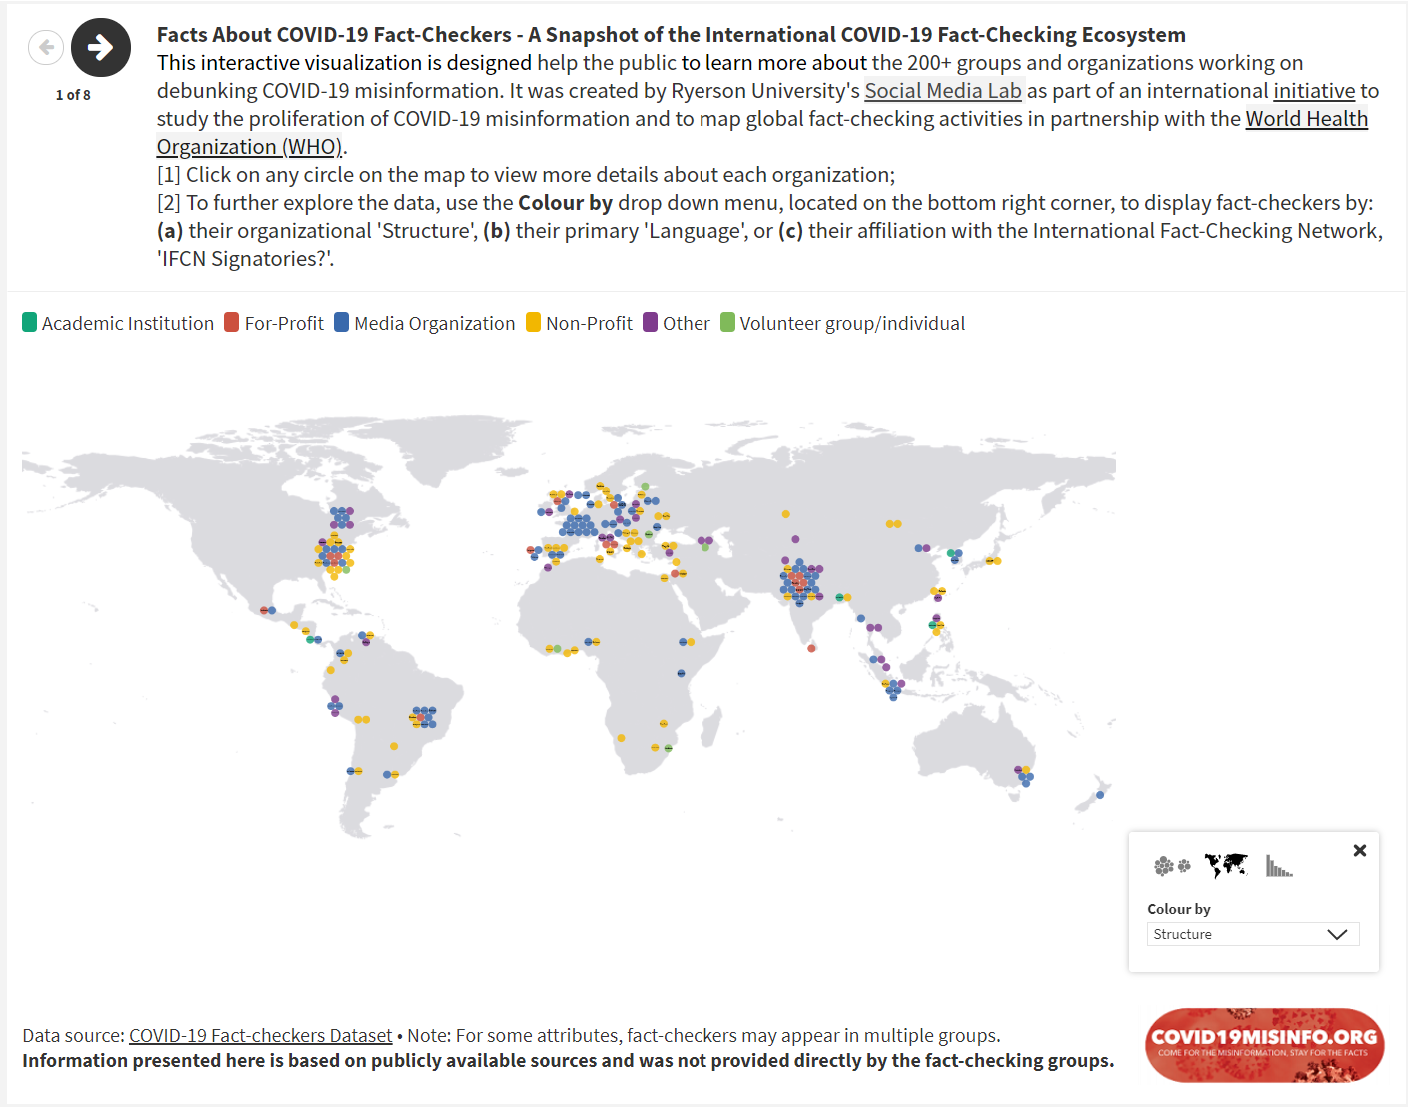
As Project Lead, I spearheaded the creation of a repository of international COVID-19 fact-checkers, cleaned, sorted, fact-checked and verified the data, analyzed the data and told stories about some of the results. Interesting insights were visualized in the Facts about Fact Checkers Flourish visualization. The data set is available here. I consulted on the COVIDGeo Misinformation Dashboard.
Then, I used qualitative research sources to create the Quick Start Guide and fact-checking tutorials for grassroots groups who wanted to learn to fact-check COVID-19 misinformation.
I learned the basics to find, understand, analyze and visualize data to find and tell important stories in this week long summer course. The focus was on data literacy and basic analysis techniques using Google Sheets, ArcGIS Online and Datawrapper.Classes covered sorting in Google Sheets, how to filter data in Google Sheets, pivot tables to see patterns and trends, basic spreadsheet calculations, web scraping, using data visualization tool Datawrapper, building maps, in addition to preparing and cleaning data to find the patterns and trends that lead to stories.
Journalist | Editor | Project Manager | Researcher